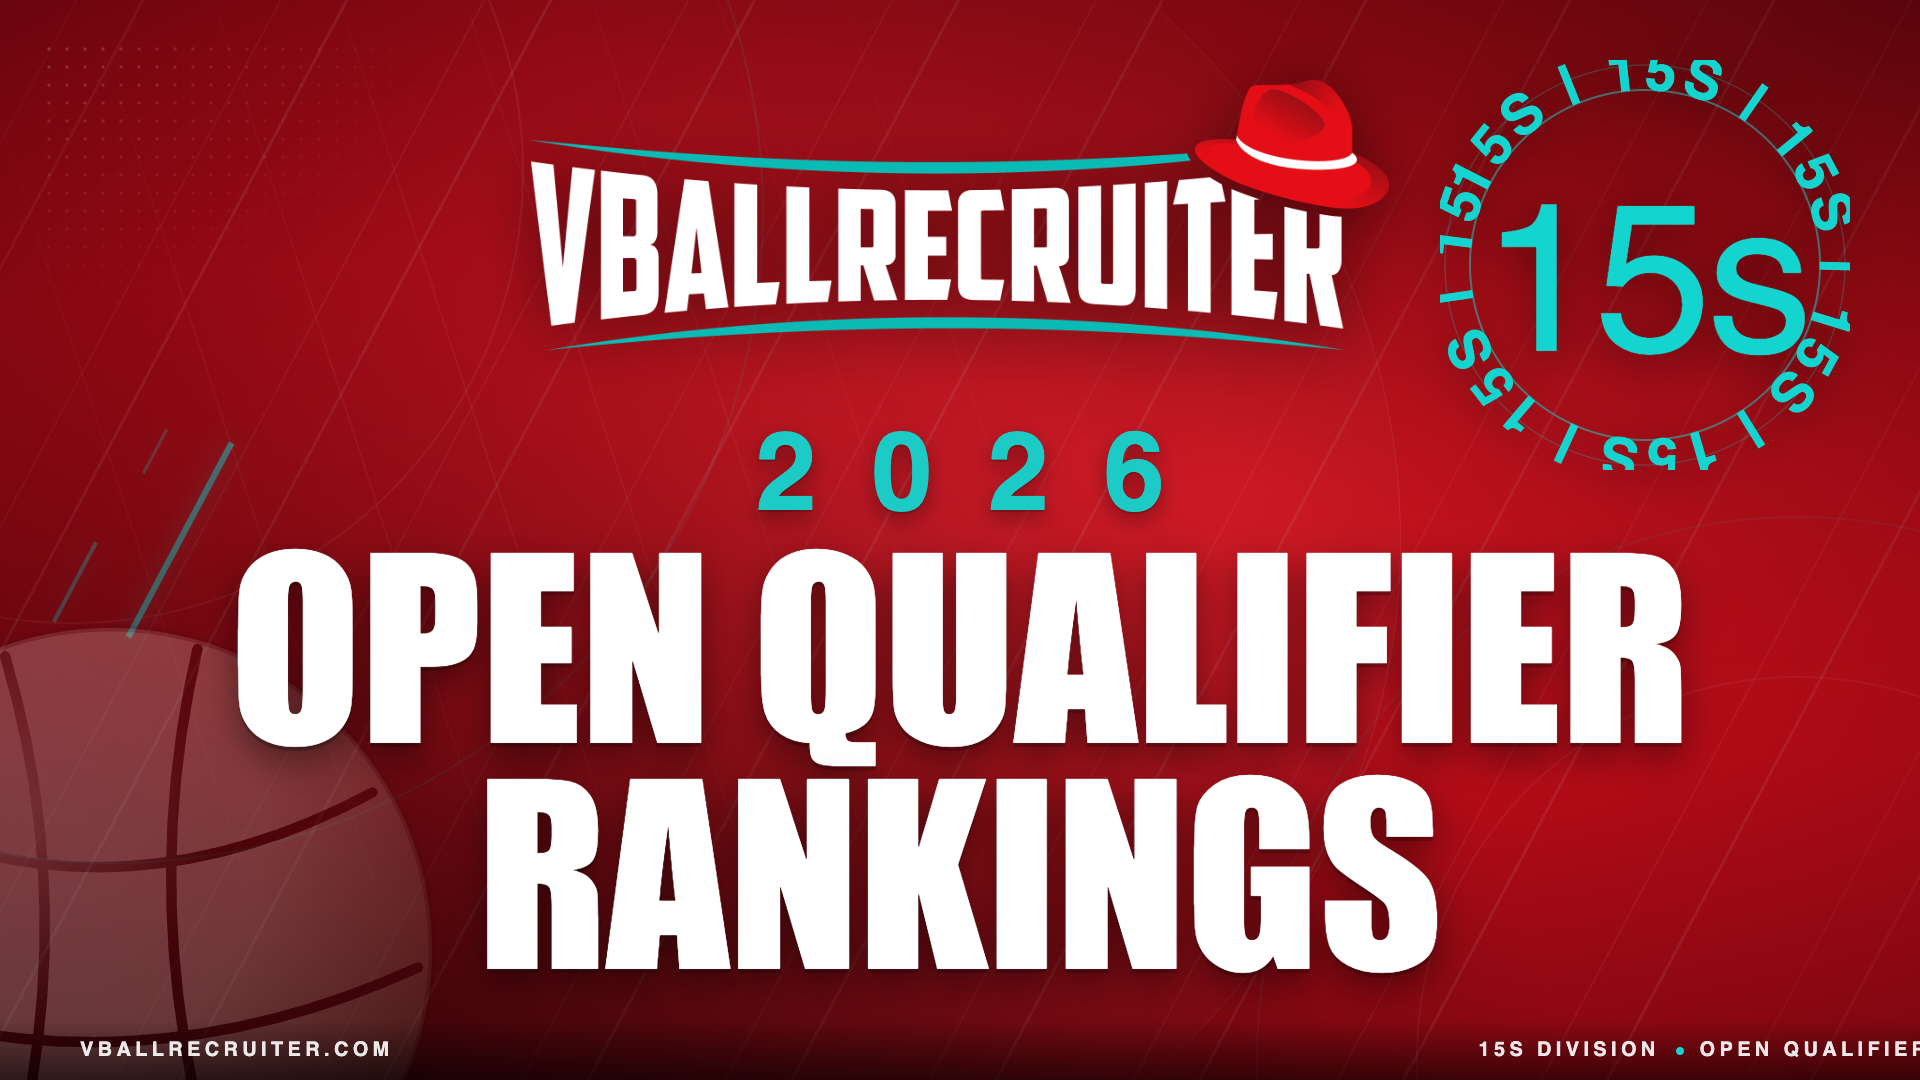
The 15s division is next in our Open qualifier rankings.
The factors taken into consideration are 1) percent chance of qualifying; 2) number of eventual qualifiers; 3) percentage of teams eventually qualified from the field; 4) number of nationally-ranked teams; 5) percentage of nationally-ranked teams in the field; and 6) average ranking of those teams. Those spots are then added up and divided by six to get an average ranking, with the goal being to get the lowest ranking, thus indicating the qualifier ranked highly in most every category.
It’s hardly an exact science. There are some obvious flaws with the way the averages are generated. For example, coming up with the chance of qualifying is done from subtracting the number of teams already having a bid from the number of teams in the field and then using the number of bids available and dividing that by the number of teams without a bid. This, of course, doesn’t take into account the odds of trickle down and get into the nitty-gritty of that, or whether it’s harder to qualify when no qualified teams are in the field versus when a bunch are in the field. The rankings are also biased and influenced heavily based on our own national rankings. Which the latest release from the month of May is used and not the rankings at the actual time of each qualifier.
At the same time, I do feel the number of eventual Open qualifiers and the percentage of that in terms of the overall field is relevant and a strong reflector of just how difficult a qualifier was or wasn’t. The lower the percentage, the less difficult a qualifier was, as compared to a qualifier that may have 50 percent or more of the field eventual qualify.
I also feel there is a lot to be taken from the overall rankings and that even though the system is far from perfect it is fairly reflective of the strength of each individual qualifier. Generally speaking, the rankings more times than not match up with the “eye test” if you will.
Here are some takeaways from this year’s breakdown. The rankings produced stark differences from 2025. Notably, is the giant gap between the top-two qualifiers and the third-place and 4-6. Windy City, at a 3.3 average, was almost two full points ahead of No. 3 Mideast at 5.2. Mideast was also third last year, with a 4.3 average.
Both Windy City and Salt Lake made big gains from a season ago. Windy City tied for No. 6 in 2025, with an average of 6.2. Salt Lake was No. 9 last season.
While Windy City and Salt Lake, at 3.7, were the clear-cut front runners this season, it’s even more remarkable that Lone Star took the top spot last year with an average of 2.7. And with that, it was crazy to see Lone Star slide all the way to 10th this year with an average of 8.2.
The two new qualifiers this year in West Coast and Boston averaged out in 13 and 14th place. Those two qualifiers ranked in the top half in 17 Open, but did not carry through to 15 Open. It’ll be interesting to see how they fare next season and if they climb the charts and by how much.
You can view the rankings and full breakdown below.
Final Rankings
1. Windy City (Avg 3.3)
2. Salt Lake Showdown (3.7)
3. Mideast (5.2)
T4. Show Me (6.2)
T4. Sunshine Classic (6.2)
6. Big South (6.5)
7. Northern Lights (7.3)
T8. Red Rock Rave (7.7)
T8. Northeast (7.7)
10. Lone Star Classic (8.2)
11. Far Western (8.7)
12. Pacific Northwest (10.5)
13. West Coast (10.7)
14. Boston (11)
***
1. WINDY CITY (Avg. 3.3)
2025 ranking: T6, Avg 6.2
Number of Teams: 31
Bids Available: 3
Number of Previously-Qualified Teams: 9
Percent Chance of Qualifying: 13.6 (7th)
Number of Eventual Open Qualifiers: 17 (2nd)
Percent Eventually Qualified from Field: 54.8 (1st)
Number of Ranked Teams from Vballrecruiter Top 50: 18 (T1st)
Percent of Ranked Teams in Field: 58.1 (1st)
Average of Ranked Teams: 23.4 (8th)
***
2. SALT LAKE SHOWDOWN (Avg. 3.7)
2025 ranking: 9, Avg 7
Number of Teams: 38
Bids Available: 4
Number of Previously-Qualified Teams: 16
Percent Chance of Qualifying: 18.2 (12th)
Number of Eventual Open Qualifiers: 19 (1st)
Percent Eventually Qualified from Field: 50 (2nd)
Number of Ranked Teams from Vballrecruiter Top 50: 18 (T1st)
Percent of Ranked Teams in Field: 46.2 (3rd)
Average of Ranked Teams: 21.7 (3rd)
***
3. MIDEAST (Avg. 5.2)
2025 ranking: 3, Avg 4.3
Number of Teams: 40
Bids Available: 4
Number of Previously-Qualified Teams: 2
Percent Chance of Qualifying: 10.5 (T4th)
Number of Eventual Open Qualifiers: 15 (3rd)
Percent Eventually Qualified from Field: 37.5 (T7th)
Number of Ranked Teams from Vballrecruiter Top 50: 17 (3rd)
Percent of Ranked Teams in Field: 42.5 (4th)
Average of Ranked Teams: 24.9 (10th)
***
T4. SHOW ME (Avg. 6.2)
2025 ranking: 8, Avg 6.3
Number of Teams: 29
Bids Available: 4
Number of Previously-Qualified Teams: 9
Percent Chance of Qualifying: 20 (13th)
Number of Eventual Open Qualifiers: 12 (5th)
Percent Eventually Qualified from Field: 41.4 (5th)
Number of Ranked Teams from Vballrecruiter Top 50: 11 (5th)
Percent of Ranked Teams in Field: 37.9 (7th)
Average of Ranked Teams: 20.5 (2nd)
***
T4. SUNSHINE CLASSIC (Avg. 6.2)
2025 ranking: 4, Avg 4.5
Number of Teams: 48
Bids Available: 4
Number of Previously-Qualified Teams: 0
Percent Chance of Qualifying: 8.3 (1st)
Number of Eventual Open Qualifiers: 13 (4th)
Percent Eventually Qualified from Field: 27.1 (12th)
Number of Ranked Teams from Vballrecruiter Top 50: 13 (4th)
Percent of Ranked Teams in Field: 27.1 (11th)
Average of Ranked Teams: 22.5 (5th)
***
6. BIG SOUTH (Avg. 6.5)
2025 ranking: 5, Avg 5.8
Number of Teams: 22
Bids Available: 3
Number of Previously-Qualified Teams: 3
Percent Chance of Qualifying: 15.8 (10th)
Number of Eventual Open Qualifiers: 10 (T6th)
Percent Eventually Qualified from Field: 45.5 (3rd)
Number of Ranked Teams from Vballrecruiter Top 50: 9 (T7th)
Percent of Ranked Teams in Field: 40.9 (6th)
Average of Ranked Teams: 23.3 (7th)
***
7. NORTHERN LIGHTS (Avg. 7.3)
2025 ranking: 2, Avg 3.7
Number of Teams: 16
Bids Available: 2
Number of Previously-Qualified Teams: 0
Percent Chance of Qualifying: 12.5 (6th)
Number of Eventual Open Qualifiers: 7 (T10th)
Percent Eventually Qualified from Field: 43.8 (4th)
Number of Ranked Teams from Vballrecruiter Top 50: 8 (9th)
Percent of Ranked Teams in Field: 50 (2nd)
Average of Ranked Teams: 34.5 (13th)
***
T8. RED ROCK RAVE (Avg. 7.7)
2025 ranking: T6, Avg 6.2
Number of Teams: 24
Bids Available: 3
Number of Previously-Qualified Teams: 3
Percent Chance of Qualifying: 14.3 (T8th)
Number of Eventual Open Qualifiers: 8 (9th)
Percent Eventually Qualified from Field: 33.3 (9th)
Number of Ranked Teams from Vballrecruiter Top 50: 7 (T10th)
Percent of Ranked Teams in Field: 29.2 (9th)
Average of Ranked Teams: 18 (1st)
***
T8. NORTHEAST (Avg. 7.7)
2025 ranking: 10, Avg 8.3
Number of Teams: 48
Bids Available: 4
Number of Previously-Qualified Teams: 2
Percent Chance of Qualifying: 8.7 (2nd)
Number of Eventual Open Qualifiers: 10 (T6th)
Percent Eventually Qualified from Field: 20.8 (13th)
Number of Ranked Teams from Vballrecruiter Top 50: 10 (6th)
Percent of Ranked Teams in Field: 20.8 (13th)
Average of Ranked Teams: 22.8 (6th)
***
10. LONE STAR CLASSIC (Avg. 8.2)
2025 ranking: 1, Avg 2.7
Number of Teams: 17
Bids Available: 3
Number of Previously-Qualified Teams: 4
Percent Chance of Qualifying: 23.1 (14th)
Number of Eventual Open Qualifiers: 7 (T10th)
Percent Eventually Qualified from Field: 41.2 (6th)
Number of Ranked Teams from Vballrecruiter Top 50: 7 (T10th)
Percent of Ranked Teams in Field: 41.2 (5th)
Average of Ranked Teams: 22.4 (4th)
***
11. FAR WESTERN (Avg. 8.7)
2025 ranking: 12, Avg 10.7
Number of Teams: 24
Bids Available: 3
Number of Previously-Qualified Teams: 6
Percent Chance of Qualifying: 16.7 (11th)
Number of Eventual Open Qualifiers: 9 (8th)
Percent Eventually Qualified from Field: 37.5 (T7th)
Number of Ranked Teams from Vballrecruiter Top 50: 9 (T7th)
Percent of Ranked Teams in Field: 37.5 (8th)
Average of Ranked Teams: 27.9 (11th)
***
12. PACIFIC NORTHWEST (Avg. 10.5)
2025: 11, Avg 10.2
Number of Teams: 22
Bids Available: 3
Number of Previously-Qualified Teams: 1
Percent Chance of Qualifying: 14.3 (T8th)
Number of Eventual Open Qualifiers: 6 (T13th)
Percent Eventually Qualified from Field: 27.3 (11th)
Number of Ranked Teams from Vballrecruiter Top 50: 6 (12th)
Percent of Ranked Teams in Field: 27.3 (10th)
Average of Ranked Teams: 24.2 (9th)
***
13. WEST COAST (Avg. 10.7)
2025 ranking: n/a
Number of Teams: 20
Bids Available: 2
Number of Previously-Qualified Teams: 1
Percent Chance of Qualifying: 10.5 (T4th)
Number of Eventual Open Qualifiers: 6 (T13th)
Percent Eventually Qualified from Field: 30 (10th)
Number of Ranked Teams from Vballrecruiter Top 50: 5 (T13th)
Percent of Ranked Teams in Field: 25 (14th)
Average of Ranked Teams: 35.8 (14th)
***
14. BOSTON (Avg. 11)
2025 ranking: n/a
Number of Teams: 39
Bids Available: 4
Number of Previously-Qualified Teams: 0
Percent Chance of Qualifying: 10.3 (3rd)
Number of Eventual Open Qualifiers: 7 (T10th)